
Science · JCE / Forces and motion
StructuredPast exam questionForm 3 · JCE
The diagram below shows a distance-time graph for a vehicle. It rises steadily from 0 km at 0 h to 300 km at 3 h, then stays at 300 km from 3 h to 4 h.
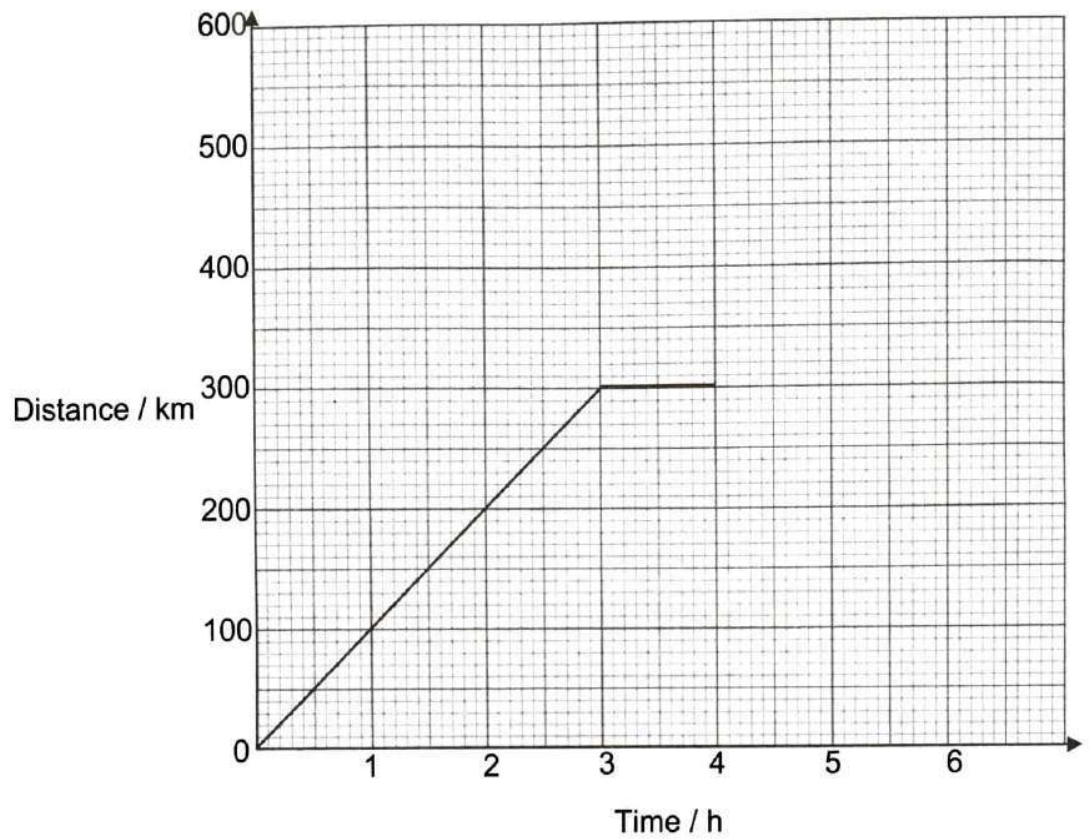
- aDefine speed. [1]
- bDescribe the motion of the vehicle between the times of 3 and 4 hours. [1]
- cCalculate the speed of the vehicle between 0 and 2 hours. [2]
- dState how the air resistance on the vehicle compares with its driving force between 0 and 3 hours. [1]
- eAfter the 4th hour, the vehicle travelled for two hours at a constant speed returning to where it started. Describe the graph for this part. [2]
You'll mark your own answer against the marking guide when you hand it in.
Source: BEC JCE Science 2021, Paper 2, Question 11
Report a problem
More like this
- A box of mass 10 kg is on Earth (g = 10 N/kg). What is its weight?
- Below is a list of terms and definitions. Match each term with its definition. Terms: transverse wave, scalar, displacement, frequency, longitudinal …
- Student R and Student S sit on a uniform beam pivoted at the centre. Student R weighs 300 N and sits 8 m from the pivot; student S has a weight F and…
- A spanner is used to loosen a nut by applying a force of 25 N at a distance of 0.2 m from the pivot as shown in the diagram.
- Answer the following about force. A ruler is placed next to a spring to measure the changes in the length of the spring when various weights are hung…
- The set-up below is used to investigate the effect of atmospheric pressure on liquids: a bottle of water with a tightly closed cap and a small open h…
- The diagram shows a marble falling through a liquid soap in a transparent container. Letters X (upwards) and Y (downwards) represent forces acting on…
- A boy is standing on a metal bar of length 8 m. The bar is supported at point A and is balanced horizontally. The boy (400 N) is standing 2 metres fr…