
StructuredPast exam questionForm 3 · JCE
The diagram shows a set-up used to investigate the effect of light intensity on the rate of photosynthesis. A pond weed was placed inside a beaker and the gas bubbles released were counted per minute.
Light intensity (watts): 0, 3, 10, 16, 25, 30, 35, 40. Number of gas bubbles released per minute: 0, 7, 20, 31, 43, 47, 50, 50. (Plot the graph on paper.)
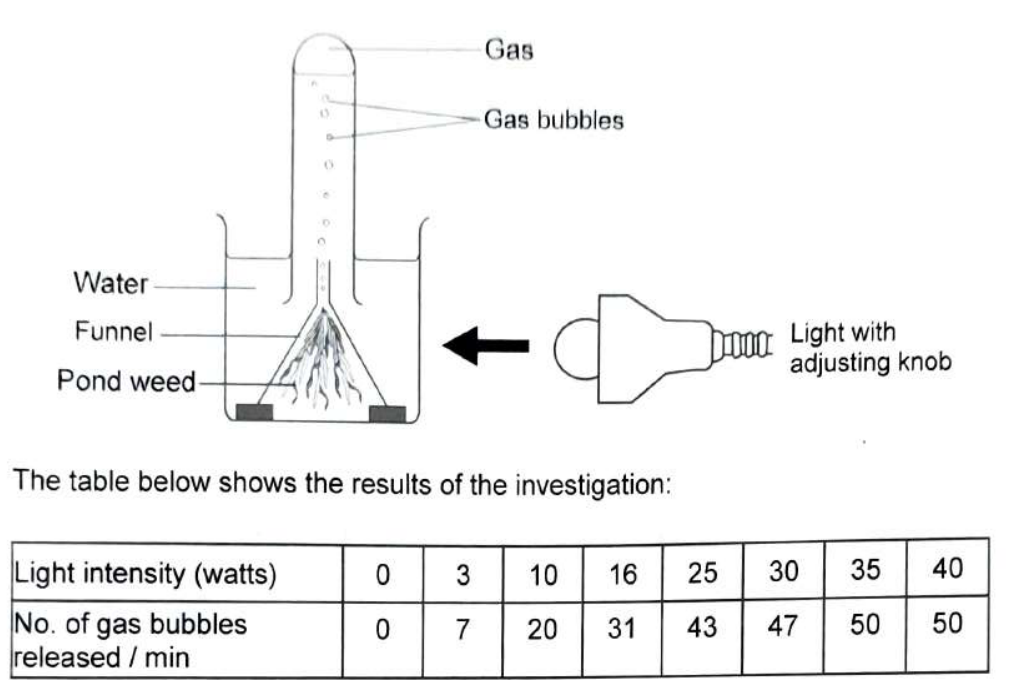
- aUsing your graph, determine the number of bubbles released per minute at a light intensity of 20 watts. [2]
- bName the gas collected during the investigation. [1]
- cExplain the observation made from the light intensity of 35 to 40 watts. [2]
- dWrite down the conclusion that could be made from the investigation. [1]
You'll mark your own answer against the marking guide when you hand it in.
Source: BEC JCE Science 2023, Paper 2, Question 14
Report a problem
More like this
- Water loss from the leaves of a plant is called…
- The diagram below shows a set-up which was used to investigate the relationship between photosynthesis and respiration. Jar 1: plant and snail, in th…
- The diagram below shows a set-up used to test for starch in a green leaf: stage 1 boil in water; stage 2 boil in alcohol (in a water bath); stage 3 r…
- The diagram shows a pond weed placed in a beaker near a lit lamp. A test tube was used to collect the gas from the pond weed.
- A student carried out the following investigation: she placed a leafy plant into a flask with water and covered the water surface with a layer of oil…
- The diagram shows steps followed when carrying out a test on a green leaf: step 1 boil in water; step 2 boil in alcohol in a hot-water bath (burner o…