
Mathematics · BGCSE / Statistics and data handling
StructuredPast exam questionForm 5 · BGCSE
Each student in a group chose one subject from Art, Design & Technology, Home Economics and Religious Education. The students' choices were to be represented in a pie chart. The table shows the sector angles of the pie chart.
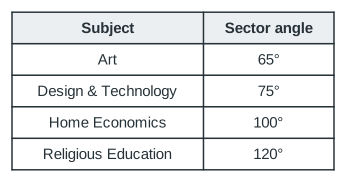
- aHome Economics was chosen by 20 students. Calculate the total number of students in the group. [2]
- bA student was picked at random from the group. What is the probability that the student chose Art? [1]
You'll mark your own answer against the marking guide when you hand it in.
Source: BEC BGCSE Mathematics 2007, Paper 1, Question 15
Report a problem
More like this
- Which measure is found from the 50th percentile of a cumulative frequency curve?
- The lower quartile is 24 and the upper quartile is 41. What is the interquartile range?
- The heights of 40 plants were grouped: 0–10 cm: 4; 10–20 cm: 10; 20–30 cm: 15; 30–40 cm: 8; 40–50 cm: 3.
- The distribution below shows the masses, in kg, at birth, of 9 babies. 3.6, 4.5, 2.9, 3.3, 2.7, 3.9, 2.8, 4.4, 3.4
- The scatter graph shows the relationship of marks scored on two courses, A and B.
- The histogram shows the speeds, in km/h, of 22 cars recorded at a point.
- The distribution shows the heights, in cm, of five athletes in a training camp: 171, 131, 159, 143, 131.
- The histogram shows the masses of a group of people (number of people per 10 kg).