
Biology · BGCSE / Plant nutrition
StructuredPast exam questionForm 5 · BGCSE
Fig. 2.1 is a graph showing the effect of carbon dioxide concentration on the rate of photosynthesis: the rate rises steadily from A to B, then stays level from B to C.
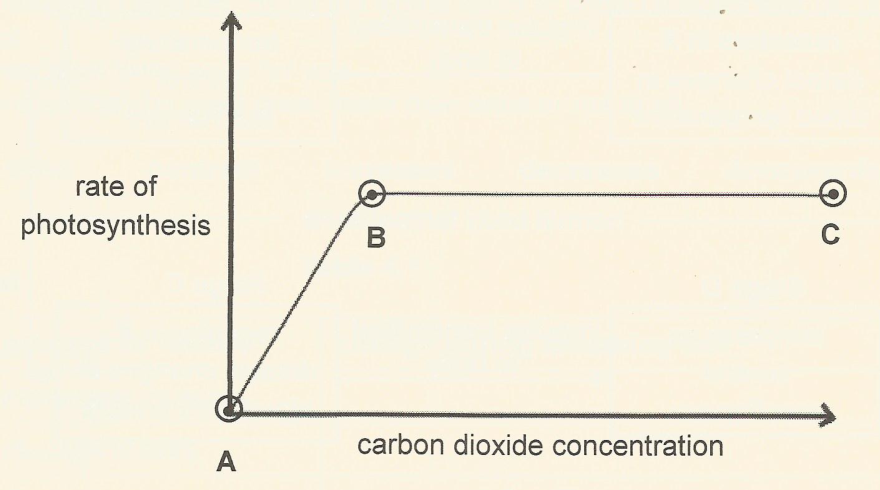
- aDescribe and explain the shape of the graph from A to B. [3]
- bDescribe and explain the shape of the graph from B to C. [2]
- cLight energy is converted by chlorophyll into a form that plant cells can use. State the form into which light energy is converted. [1]
You'll mark your own answer against the marking guide when you hand it in.
Source: BEC BGCSE Biology 2016, Paper 3, Question 2
Report a problem
More like this
- A student puts a potted plant in the dark for 48 hours, then covers part of one leaf with foil and leaves the plant in sunlight for 6 hours. The leaf…
- Describe and explain how magnesium deficiency in the soil would affect the development of a plant grown from a stem cutting.
- Fig. 5.1 is a graph showing the effect of carbon dioxide concentration and light intensity on the rate of photosynthesis.
- Fig. 1.1 shows a section through a leaf.
- Fig. 4.1 shows the results of an experiment investigating the effects of growing plants in different solutions of mineral salts: plant S is tall and …
- Figure 2.1 shows the amount of bean seeds harvested from fields where varying amounts of a nitrogen-containing fertiliser had been applied. Bean plan…