
Social Studies · JCE / Physical environment and climate
StructuredPast exam questionForm 3 · JCE
Use the climate graph provided (temperature about 25 °C most of the year, dipping slightly in mid-year; rainfall in every month, highest in October and November). Source: Social Studies is Fun by V. Ngongola, K. Selwe (2007).
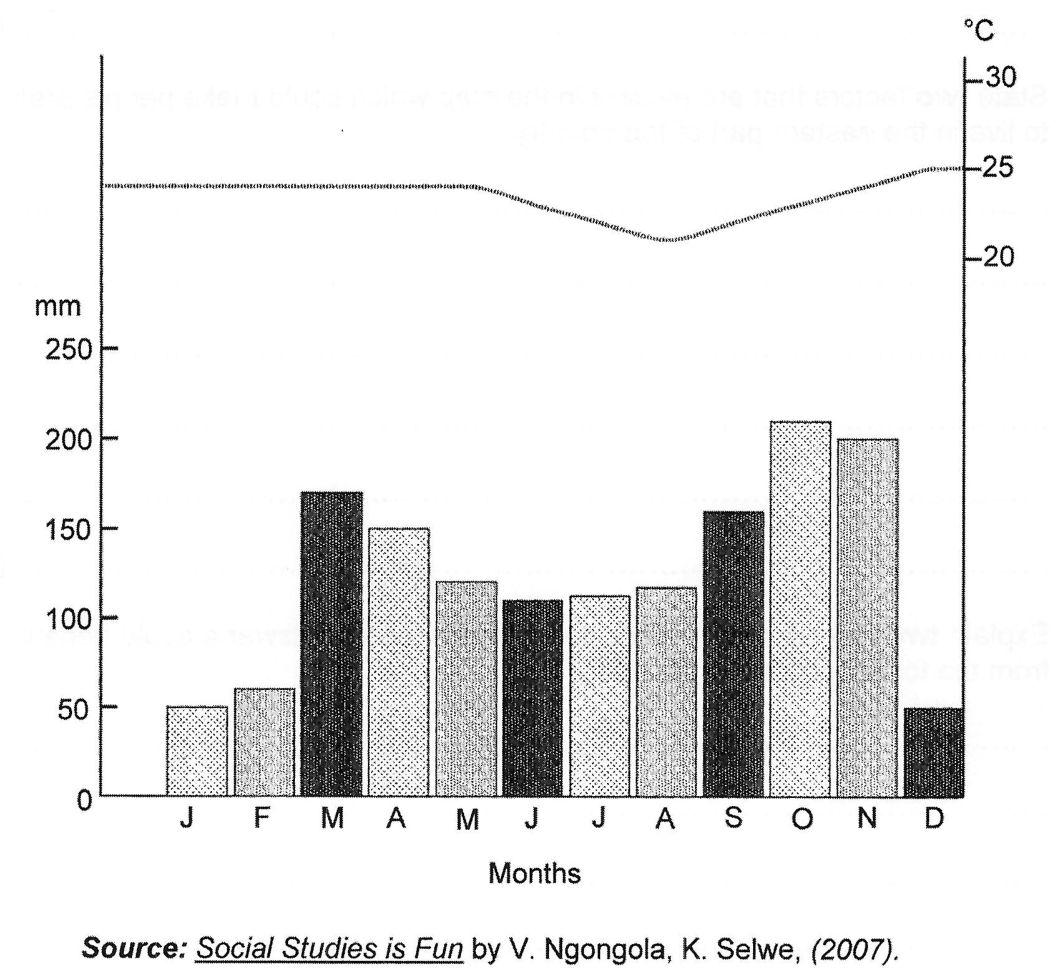
- aWhich climatic zone is reflected by the graph? [1]
- bState two elements of weather that are evident in the graph. [2]
- cWhat conclusion can be made about the weather elements for the month of October? [1]
- dDiscuss two ways in which the climate shown in the graph would influence the life style of the people living around the climatic region. [6]
You'll mark your own answer against the marking guide when you hand it in.
Source: BEC JCE Social Studies 2015, Paper 2, Question 2
Report a problem
More like this
- Study the map of East Africa below, showing the East African Rift zone.
- Study the map of Africa below. Region L is the Congo Basin.
- Study the map of Africa below. Area S is in the north-west of the continent.
- Use the picture below (layers of rock squeezed from both sides, with an arrow pointing upwards).
- Answer the following about lakes.
- Use the diagram below illustrating one type of rainfall (warm ocean, prevailing winds rising over a hill, rain on the windward side and a rain shadow…
- The table below shows climatic conditions in country X.
- Study the map of Botswana below. X is the Okavango Delta.