
Chemistry · BGCSE / Rates of reaction
StructuredPast exam questionForm 5 · BGCSE
An energy diagram for the production of ethanol by the addition of steam to ethene is shown.
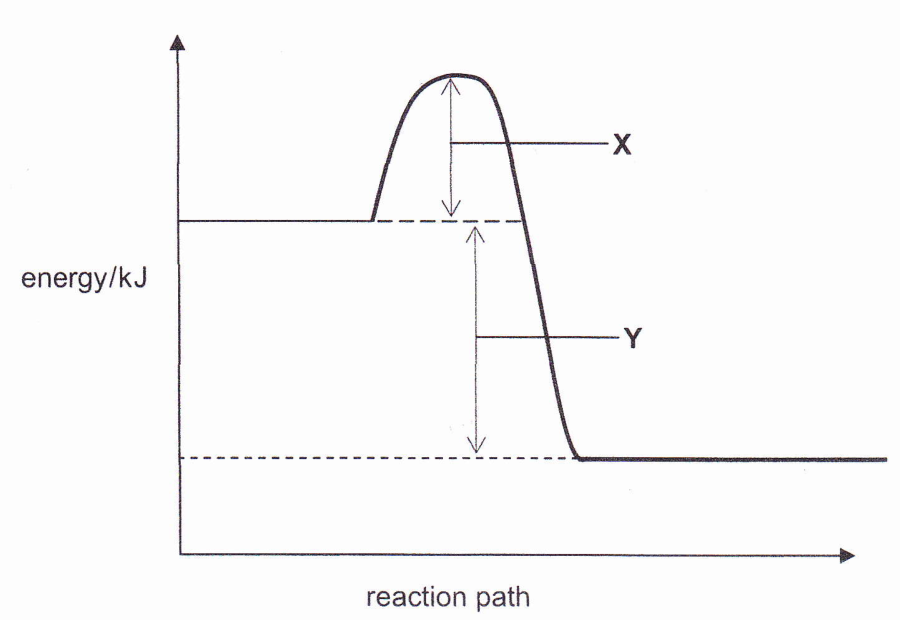
- aDescribe where the energy levels of the reactants and the products are on the diagram. [1]
- bWhat do the letters X and Y in the diagram represent? [2]
You'll mark your own answer against the marking guide when you hand it in.
Source: BEC BGCSE Chemistry 2012, Paper 3, Question 3(a)
Report a problem
More like this
- Which changes speed up a reaction?
- A catalyst…
- Marble chips react with dilute hydrochloric acid. A student measures the volume of gas every 30 seconds.
- Ammonia is manufactured using the Haber process: N₂(g) + 3H₂(g) ⇌ 2NH₃(g), ΔH = −92 kJ/mol. The graph shows how the yield of ammonia changes with pre…
- A student investigated the reaction of magnesium with dilute hydrochloric acid at 25 °C: Mg(s) + 2HCl(aq) → MgCl₂(aq) + H₂(g). The volume of hydrogen…
- A student carried out experiments using calcium and water. In experiment I, a cleaned piece of calcium of mass 0.6 g was added to 200 cm³ of water: C…
- The diagram shows the stages during the manufacture of sulphuric acid by the Contact Process.
- Sulphur trioxide, SO₃, is produced from sulphur dioxide, SO₂: 2SO₂(g) + O₂(g) ⇌ 2SO₃(g).